
Visual configure, price and quote (CPQ) solutions boost conversions by streamlining the quoting process, enhancing the customer experience and measuring and analyzing key metrics.
Key Takeaways
- Visual CPQ solutions help boost conversions by optimizing product configurations and streamlining the quoting process.
- Implementing visual CPQ solutions can enhance the customer experience by enabling self-service configurations and providing real-time pricing information.
- Measuring and analyzing conversion metrics provides clarity on customer needs and preferences — essential for optimizing product configurations and increasing conversions.
How Visual CPQ Solutions Boost Conversions
Visual CPQ solutions streamline the quoting process, enabling sales teams to generate accurate, real-time quotes. Reducing the time and effort required to create quotes allows sales teams to focus on closing deals and driving revenue.
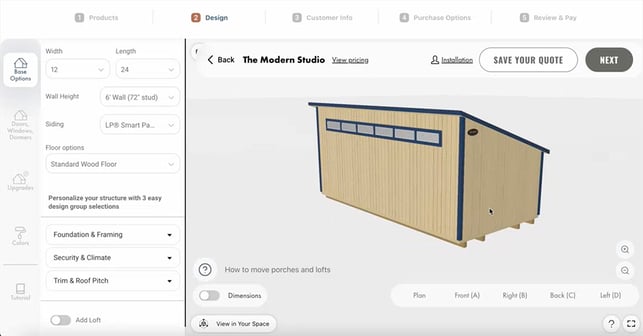
Visual CPQ solutions also enable scalable, real-time customization of your products, which helps your customer feel more invested and confident about their purchasing decision. With access to real-time inventory information, this tool reduces customer frustration and improves transparency and brand trust.
Additionally, by leveraging advanced visualization technology, you can provide B2B customers with a more immersive and engaging product experience. This improves the likelihood of conversion as well as increasing customer satisfaction.
.png?width=542&height=345&name=cpq-001%20(1).png)
Implementing Visual CPQ Solutions
Choose the Right Visual CPQ Solution
When it comes to choosing the right visual CPQ solution for your manufacturing business, there are several factors to consider.
- Integration and implementation: Look for a solution that integrates seamlessly with your existing PIM, CRM, ERP and ECM systems and workflows, to minimize disruption to operations.
- Ease of use: The solution should be intuitive and user-friendly, allowing your team to quickly adapt and start leveraging its capabilities. Training and support should be provided to ensure successful implementation.
- Comprehensive features and benefits: For maximum use, the tool should include key features such as product configurators, real-time quoting capabilities and visualization tools.
- Industry expertise: Choose a provider that has experience in the B2B commerce industry and can offer guidance and resources to help you succeed.
Choosing the right visual CPQ solution for your manufacturing business requires careful evaluation of your options.
Automate Quoting and Pricing
A visual CPQ solution can automate accurate quote generation, reducing the risk of error and ensuring that pricing is consistent across different channels and sales teams. The solution can be integrated with existing ERP and PIM systems, allowing for real-time access to product, inventory and pricing information.
With the ability to generate accurate quotes instantly, sales teams can respond to customer inquiries promptly and efficiently. This not only improves customer satisfaction but also increases the chance of closing a deal. Real-time quoting capabilities also enable sales teams to provide pricing options and negotiate with potential customers, leading to faster sales cycles and improved conversion rates.
In addition, a visual CPQ solution can provide valuable insights into your quoting and pricing processes. By analyzing data and metrics, you can identify areas for improvement and optimize pricing strategies. This data-driven approach helps reduce waste and drive business growth.
This solution also allows dynamic pricing strategies to optimize conversions. By analyzing market trends, customer behavior and competitor pricing, you can adjust prices in real-time. Dynamic pricing algorithms can take into account factors such as demand, seasonality and inventory levels to determine the optimal price for each product.
Design User-Friendly Product Configurators
A well-designed visual product configurator allows your audience to easily customize products according to their preferences. Here are some key considerations for designing intuitive, user-friendly product configurators:
-
Simplify the user interface: A clutter-free and intuitive interface helps users navigate effortlessly through the configurator. Use clear and concise labels, icons and tooltips to guide users in the customization process.
-
Provide real-time feedback: Incorporate visual cues and instant updates to show customers how their choices impact the final product. This helps users make informed decisions and increases their engagement.
-
Streamline the customization process: Break down customization options into logical steps or sections. This makes it easier for users to understand and complete the configuration process without feeling overwhelmed.
-
Offer guidance and assistance: Include tooltips, help icons and contextual information to assist users in understanding the available options and their implications.
-
Optimize for mobile devices: Ensure that the configurator is responsive and works well on a variety of screen sizes and web browsers. This allows users to customize products on-the-go, increasing convenience and accessibility.
Leverage Visualizations to Enhance Product Customization
Providing customers with a visual representation of their configured product helps them make informed decisions and feel more confident in their choices. The benefits of including high-quality visualizations are numerous.
- Improved customer engagement: Visualizations allow customers to see how their chosen options will look in real life, increasing their engagement and satisfaction.
- Reduced errors and returns: By visualizing the final product, customers can identify any potential issues or discrepancies before making a purchase, reducing the likelihood of errors or returns.
- Enhanced personalization: Visualizations enable your audience to customize products to their exact preferences, creating a personalized experience that meets their unique needs.
To effectively leverage visualizations for product customization, use high-quality images that accurately depict the product's features and options.
Where possible, offer interactive features, such as 360° views and zoom capability, which allow customers to explore the product from different angles and get a comprehensive understanding of its design.
Providing real-time updates as customers make changes to their product configuration, so they have immediate visual representation of their choices, will also increase customer satisfaction.
Enable Self-Service Configurations
With the implementation of a self-service portal, customers can easily access product information and images, reducing the need for manual assistance.
A self-service portal ensures that stakeholders always have access to the latest and updated materials, eliminating the risk of outdated files. This brand control feature helps businesses maintain consistency and professionalism in their communication.
Understand Customer Needs and Preferences
By gaining insight into what customers want and value, you can tailor product offerings to meet those needs, ultimately increasing the likelihood of conversion.
This requires conducting market research, analyzing customer feedback and staying up-to-date with industry trends. Leverage data analytics to identify patterns and trends in customer behavior, which will allow you to make data-driven decisions when it comes to product development and customization.
Measuring and Analyzing Metrics
Identify Key Metrics
In order to maximize conversions, identify and track key metrics that indicate the effectiveness of marketing and sales efforts. These metrics provide valuable insights into customer behavior, sales performance and overall business growth.
By analyzing these metrics, you can make data-driven decisions to optimize conversion strategies and improve your bottom line.
Some important metrics to consider include:
-
Conversion rate: The percentage of website visitors or leads that convert into paying customers. This metric indicates the effectiveness of the sales funnel and the ability to convert prospects into buyers.
-
Average order value: The average amount of revenue generated per customer order. This metric helps identify the purchasing behavior of customers and potential opportunities to increase sales.
-
Customer lifetime value: The total revenue generated by a repeat customer since their first purchase. This metric is used to assess the long-term value of customer relationships and prioritize customer retention strategies.
-
Cart abandonment rate: The percentage of website visitors who add items to their shopping cart but leave the site without completing the purchase. This metric highlights potential barriers or issues in the checkout process that may be impacting conversions.

Utilize Data Analytics Tools
Use data analytics to inform business decisions. This may involve personalizing marketing campaigns, optimizing product configurations and improving the quoting process based on data insights.
Be sure to collect data from various sources, such as website analytics, customer surveys and sales reports. Then regularly monitor and measure conversion metrics to track the effectiveness of strategies. This can involve tracking conversion rates, average order value and customer lifetime value.
Leverage A/B Testing
In addition to analytics tools, you can leverage A/B testing to track and monitor conversion performance. A/B testing involves comparing two versions of a webpage or marketing campaign to determine which one performs better, in terms of conversions.
By testing different elements such as headlines, call-to-action buttons or product images, you can identify the most effective strategies for driving conversions.
Manufacturers can maximize conversions and business growth by utilizing visual CPQ solutions, empowering consumers by providing real-time customization, pricing and availability information.
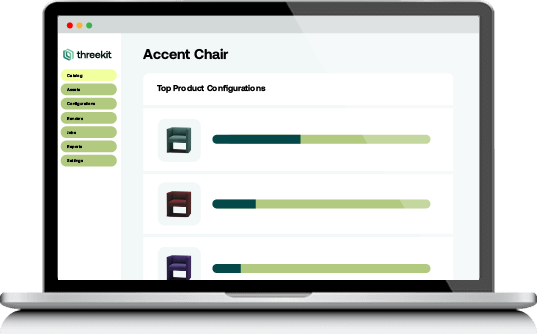
Threekit provides a comprehensive suite of ecommerce, product information management (PIM) and digital marketing tools. Its visual CPQ solution integrates seamlessly with existing CRM, ERP and ECM systems for minimal disruption to operations and increased scalability.
Schedule a demo today to see how Threekit can help maximize conversions for you.